Simultaneous vs sequential fit
pymultieis offers a fit_sequential() method for fitting individual spectra with or without a dependence.
It is based on the regular complex nonlinear least squares and uses the least-squares minimization algorithm
from the Pytorch-minimize library .
1: Preserving correlation between parameters
For simpler models, it is possible to observe tendencies of parameter changes using both fit_sequential() and the simultaneous fit methods.
a. Nyquist plot
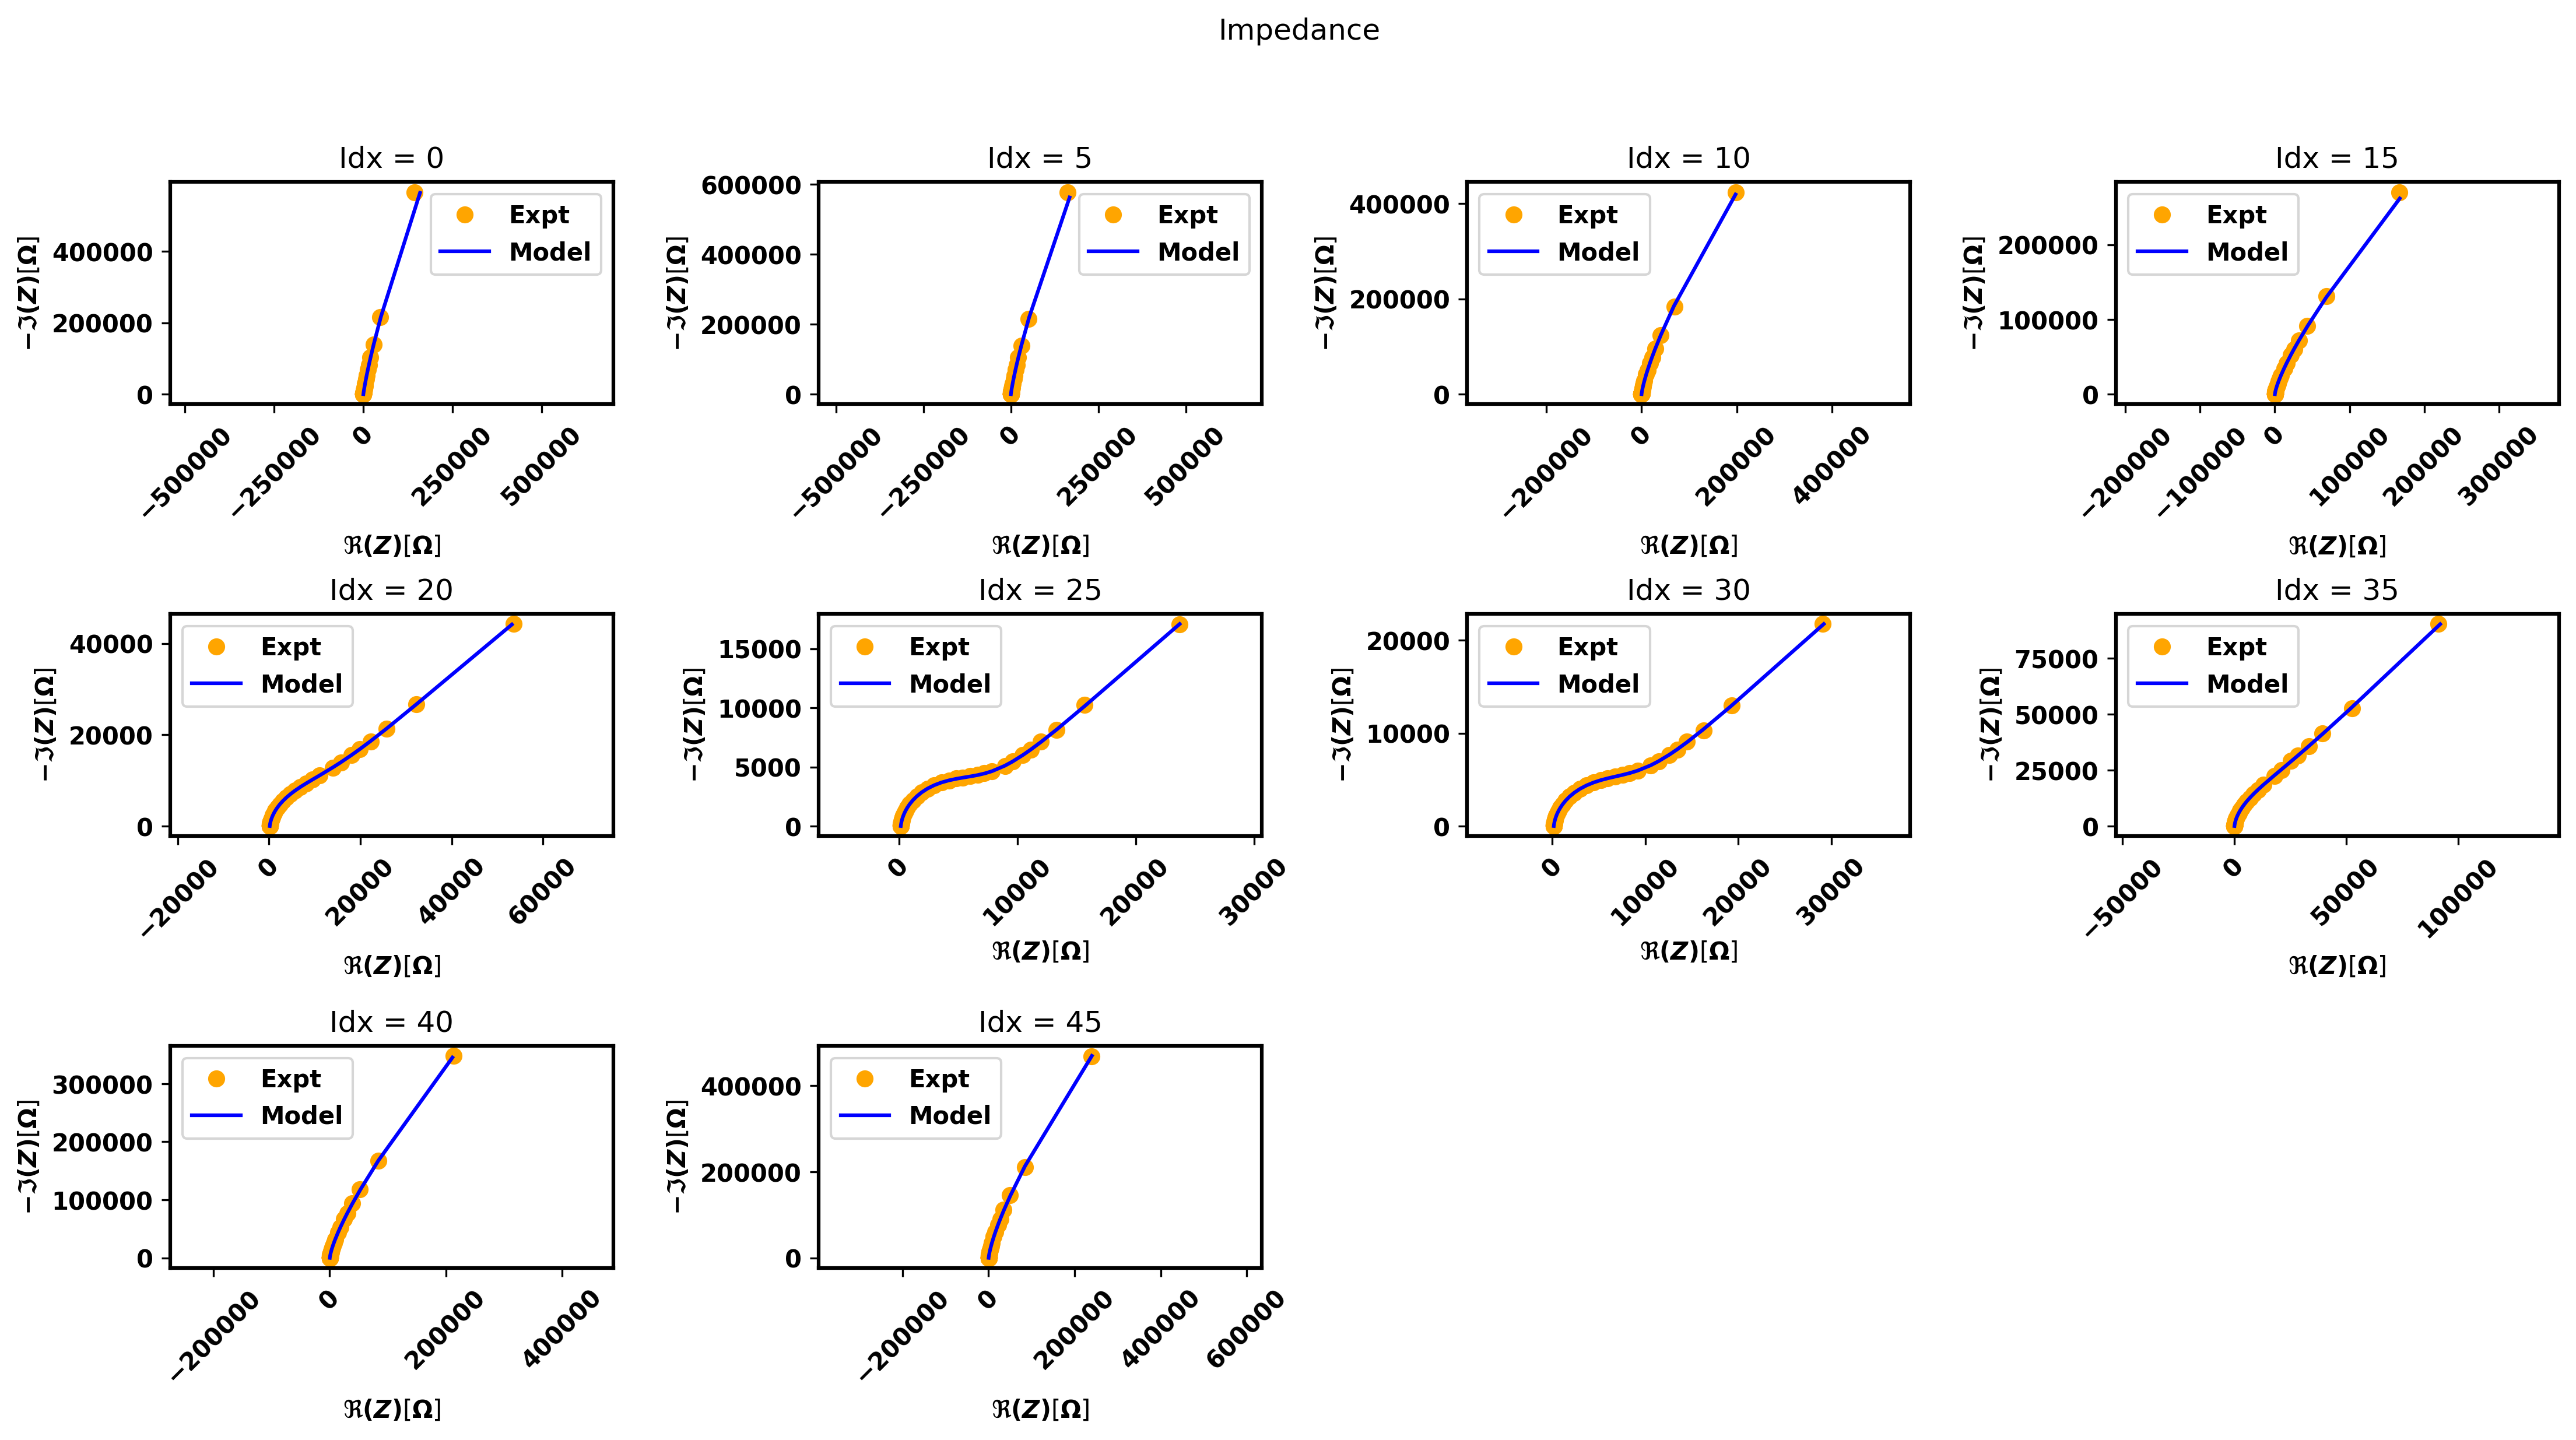
A sequential fit on all spectra

A simultaneous fit
b. Parameter plot
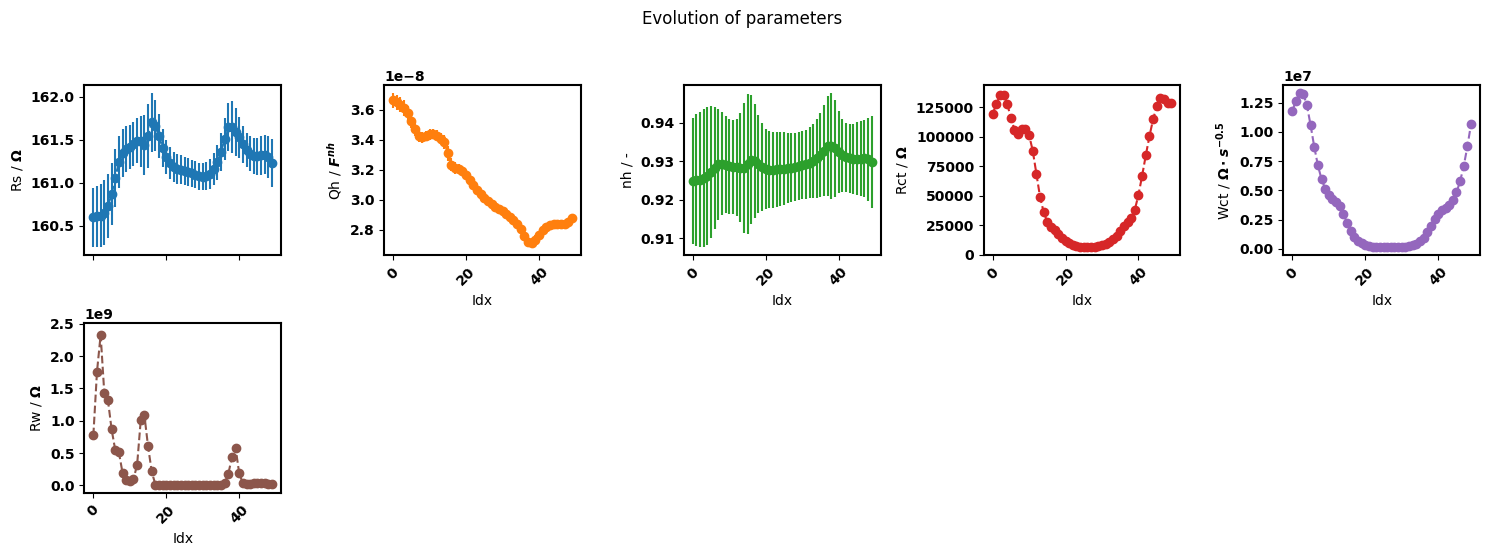
A sequential fit on all spectra
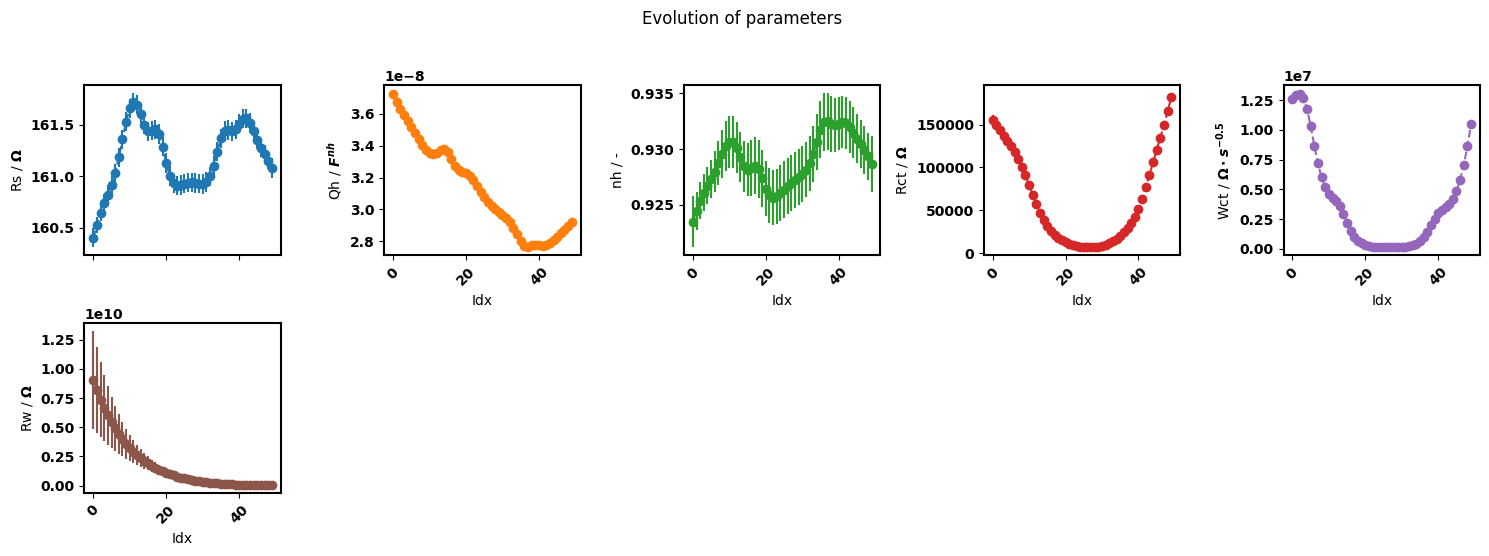
A batch fit
However as the model becomes more complicated or the spectra noisier, fit_sequential() becomes more susceptible to jumps in the values of the
parameters and therefore loses the ability to preserve the dependence between spectra. This is where the fit_simultaneous() method becomes essential.
This method preserves the correlation between parameters, is slightly less sensitive to initial values and can be used to obtain a reasonable initial guesses.
Basically, the idea is to initially fit the data with fit_simultaneous() and then run fit_sequential() or fit_simultaneous_zero().
A detailed example can be found in the Examples page.
import pymultieis as pym
eis_her_sequential = pym.Multieis(p0, F_her, Y_her, bounds, smf_modulus, her, weight= Yerr, immittance='admittance')
eis_her_sequential.fit_sequential()
eis_her_sequential.plot_params()
Sequential fit only
eis_her_simultaneous = pym.Multieis(p0, F_her, Y_her, bounds, smf_modulus, her, weight= 'modulus', immittance='admittance')
popt, perr, chisqr, chitot, AIC = eis_her_simultaneous.fit_simultaneous()
popt, perr, chisqr, chitot, AIC = eis_her_simultaneous.fit_sequential()
eis_her_simultaneous.plot_params()

Simultaneous fit followed by sequential fit
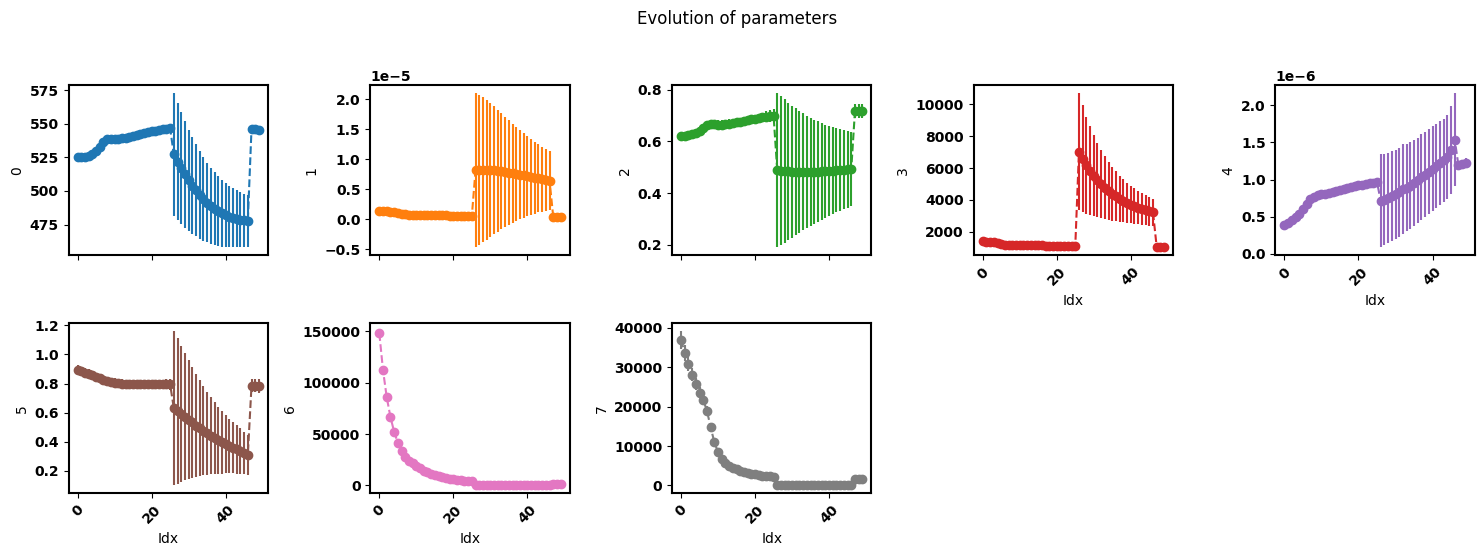
2. Fitting a subset of the sequence of data
The fit_sequential() offers a possibility to fit only a subset of the total spectra based on the index of the spectra.
popt, perr, chisqr, chitot, AIC = eis_redox_sequential.fit_sequential(indices=[1, 2, 15, 25, 45])
eis_redox_sequential.plot_nyquist()
eis_redox_sequential.plot_params(show_errorbar = False, labels = labels)
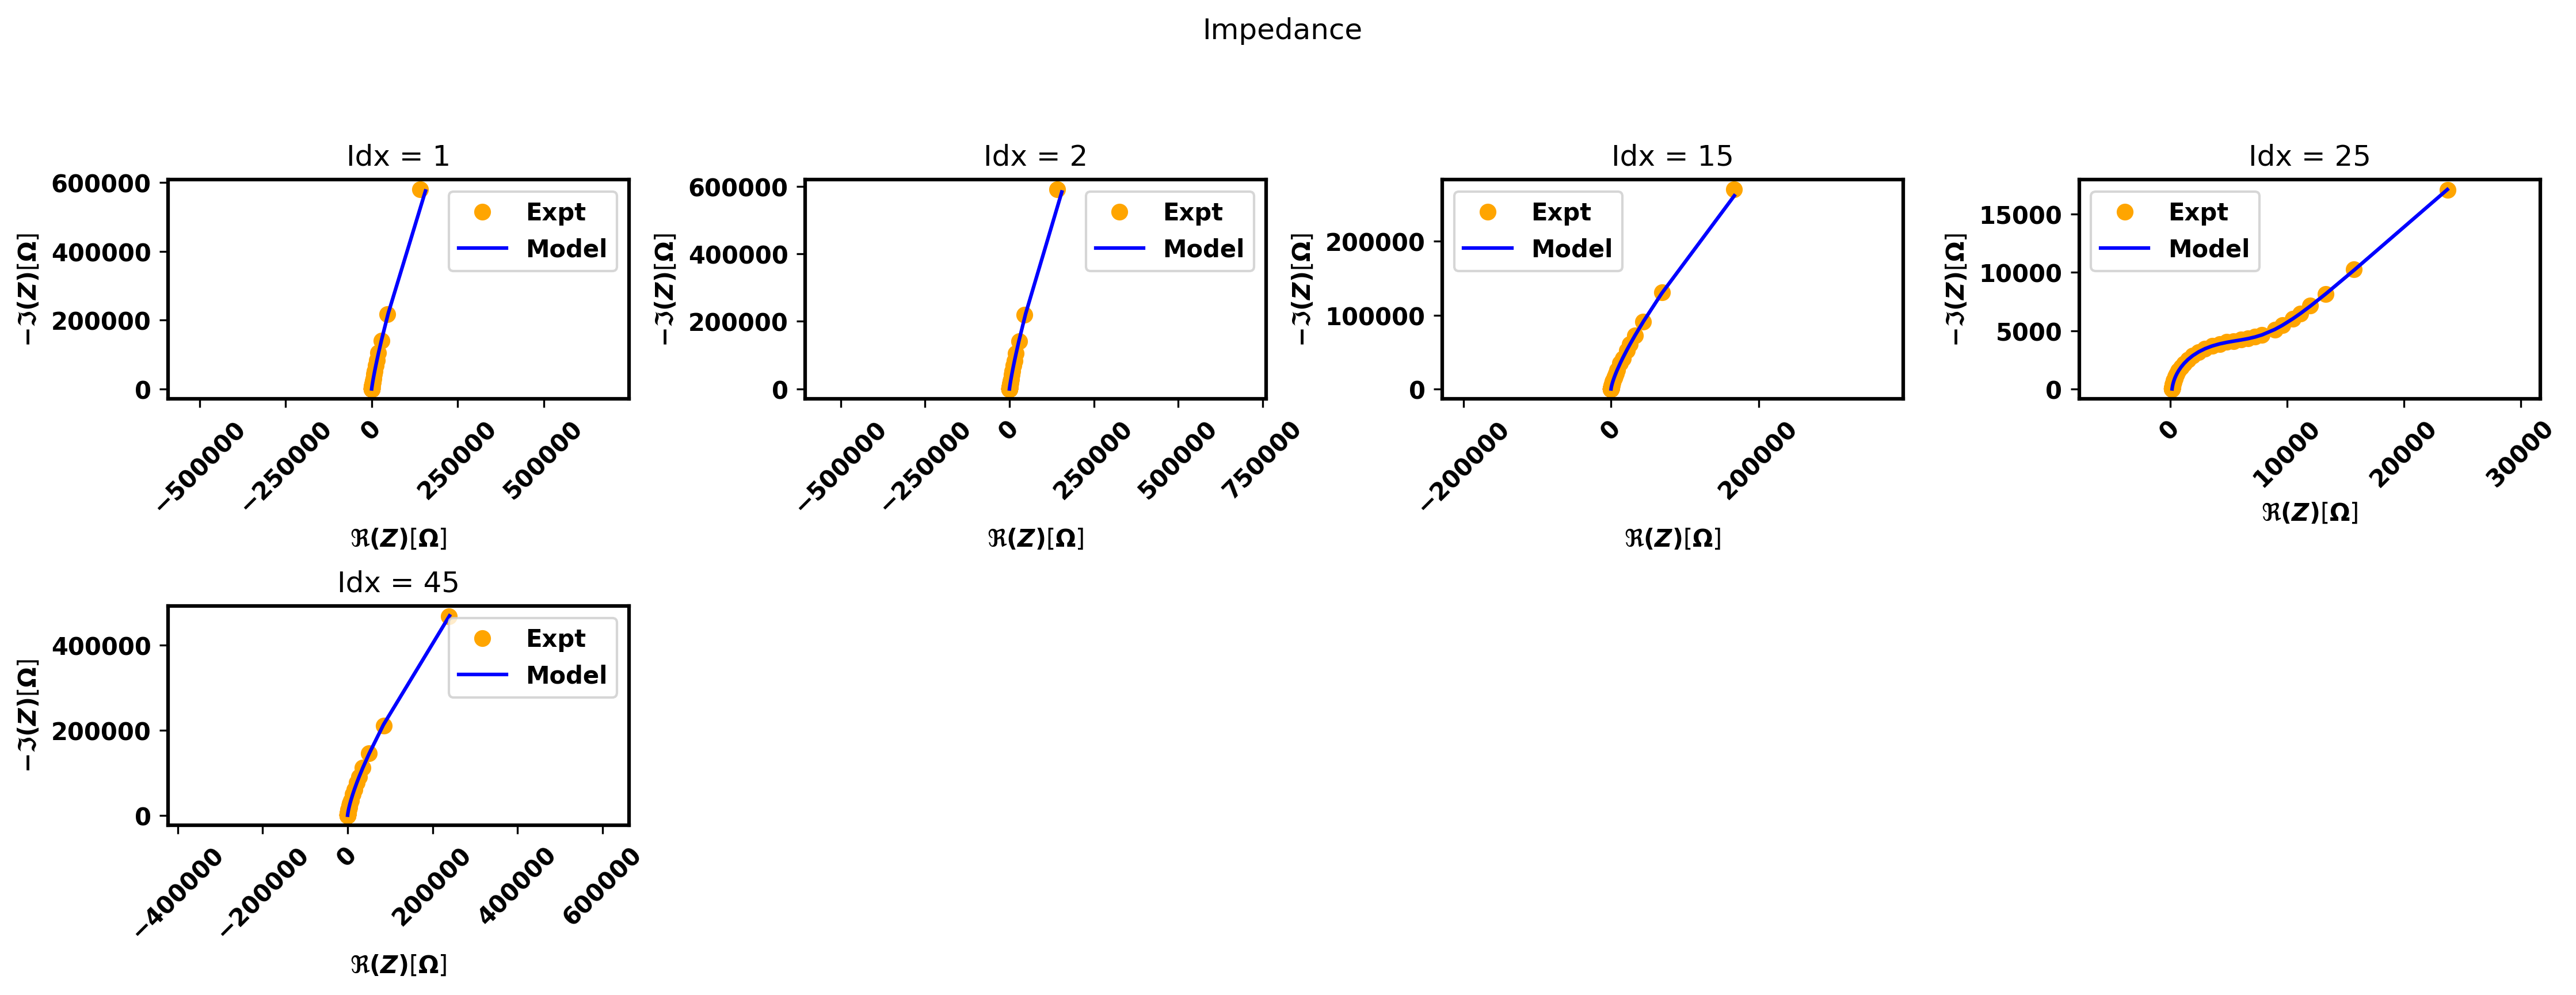
A sequential fit on selected spectra
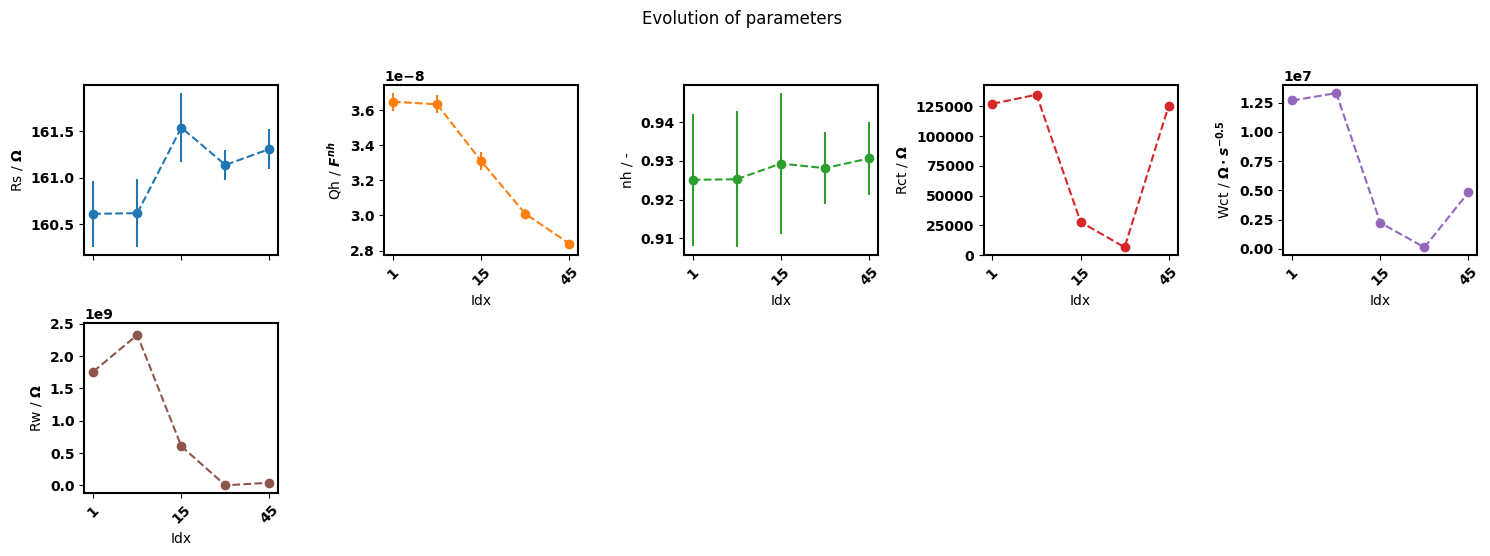
Parameter trend obtained from sequential fit of selected spectra
More examples on using fit_sequential() can be found in the Examples page.